Jordan enjoys writing data-driven game previews and analysis articles — especially for MLB markets or NFL/NBA props. And as a proud Ohio University grad, he’ll always have a soft spot for college sports (especially if the Bobcats are involved). Previous stops include mlb.com, Sportsnet and The Athletic.
The Toronto Blue Jays continue their homestand tonight with the Oakland Athletics in town.
The pregame narrative: Toronto just took two of three at Rogers Centre against the AL East-leading Baltimore Orioles, and I think the Jays will win again tonight. Vladimir Guerrero Jr.’s hitting streak is up to 20 games, and I’m interested in backing him to stay hot.
Check out the best Blue Jays picks vs. the Athletics on Aug. 9.
I don’t always pay close attention to home/road situations in baseball, but I think tonight’s matchup being in Toronto makes a difference for the Blue Jays’ chances to win.
The A’s have played their past 18 games in California. After a cross-continent flight, they’re playing in the Eastern Time Zone for the first time since July 14 (before the all-star break).
Oakland is 19-38 on the road this year, which includes a 13-26 record when playing on Eastern or Central Time.
And it just so happens that the A’s are running into a pitcher who cherishes his home-field advantage.
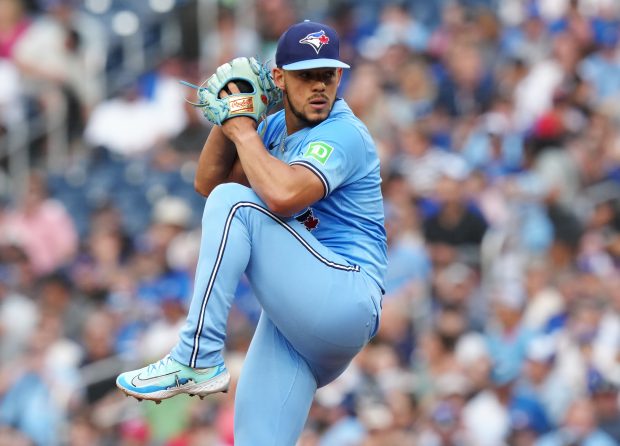
Jose Berrios (9-9, 4.11 ERA) is having a mediocre year, as his 99 ERA+ indicates. But the results tend to improve when he’s pitching at Rogers Centre.
Berrios at home (11 starts): 2.99 ERA, .607 opponent OPS
Berrios on the road (12 starts): 5.29 ERA, .873 opponent OPS
Toronto is 9-2 with Berrios pitching at The Dome and 5-7 when he pitches elsewhere.
In a limited sample, the Blue Jays’ right-hander has held Oakland’s lineup in check: .214 BA and .321 SLG in 28 plate appearances. Similar success from Berrios tonight should lead to a win, especially if Vladdy can continue to drive the bus for the offence.
Key stat: Since 2022, Berrios has a 3.55 ERA at home. Toronto is 31-11 in his home starts over that span.
Quick pick
Guerrero over 0.5 runs (-106): Once again, Guerrero did it all for the Blue Jays in last night’s narrow win. He went 3-for-4 with two runs and four RBI, finishing a single shy of the cycle.
During his 20-game hit streak, the all-star first baseman has a staggering .575 on-base percentage. When someone is getting on base at such a staggeringly high clip, it makes this prop look particularly enticing.
Vladdy has scored 23 runs over his past 20 games, cashing this bet 15 times.
A’s starter Mitch Spence hasn’t been very sharp in recent outings, which is part of the rationale, too. Spence has a 5.30 ERA and an .810 opponent OPS over his past seven outings.
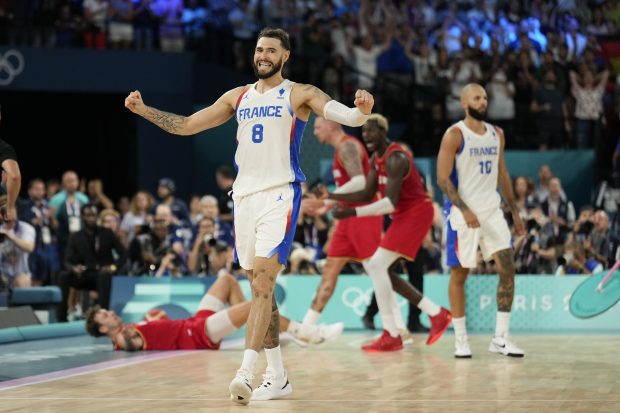
After surviving a huge scare in the semifinals, Team USA is heavily favoured over host nation France in the Olympic men’s basketball tournament gold medal match.
The pregame narrative: Facing a 13-point deficit in the fourth quarter, the U.S. surged back for a dramatic win over Serbia. The Americans are 17-point favourites over Victor Wembanyama and France, who upset Canada and Germany to get here.
Check out our USA vs. France odds and best bet for the gold medal game on Aug. 10.
Serbia had an almost literally golden opportunity to dethrone Team USA in the semifinals, but a total meltdown in the bright lights of crunch time quashed that hope.
Do I think that game can wake up the Americans a bit? Similar to how some uneasy results in pre-tournament play led to a dominant run through the quarterfinals? For sure.
But I also know that France will have a raucous home crowd behind it. I’m not calling for an upset here, but France should hang a little closer than this.
Look at what France did as an 8-point underdog against Canada and as a 5-point underdog against Germany. Victor Wembanyama was atrocious as a scorer in both games and it didn’t matter.
Wemby shot a combined 6-for-27 (and 1-for-14 from 3-point range) in those matchups.
But teammates like Isaia Cordinier (6-for-10 from 3-point range) and Guerschon Yabusele (39 points) picked up the slack to help beat a pair of deeply talented teams.
Now just imagine if Wembanyama turns in a better performance.
Either way, I don’t think playing the what-if game is necessary. France has found other avenues to score, and Wemby provides elite value as a defender regardless of what he’s doing on the offensive end.
The USA has coasted to victory in most of its games. But the gold medal match should be more competitive than the spread indicates.
Key stat: France has covered this spread in all 13 international games it’s played in 2024.
Research has its place in all forms of sports betting, but baseball’s setup is unique. Throughout a six-month campaign, extensive sample sizes and opportunities for emerging trends can really assist your wagering decisions.
If you’re looking for insights related to game results, props, futures and more, our MLB betting strategies guide will arm you with the information you need before placing your next wager.
-> New to MLB wagering? Sign up at NorthStar Betsto get the latest odds, insights and betting tools throughout the season.
-> New to MLB wagering? Sign up at NorthStar Betsto get the latest odds, insights and betting tools throughout the season.
MLB betting strategies
Thanks to the mainstream embrace of sabermetrics, MLB generates more publicly available data than any other sport. Acronyms like WAR, FIP and wRC+ fill digital stat sheets. Spin rates, exit velocities and launch angles tell another story altogether.
To avoid information overload, you might want to focus on just a couple of research techniques and tactics. We’ll provide a thorough review of different betting strategies.
-> Before you get started, create your NorthStar Bets account to explore live odds and daily MLB markets.
-> Before you get started, create your NorthStar Bets accountto explore live odds and daily MLB markets.
Moneyline and run line strategies
Who’s the starting pitcher?
Much like goalies in hockey, starting pitchers in baseball wield a great deal of influence in betting odds. That’s because starters are expected to cover more than half the innings in a game and they possess the opportunity to shut down the opposition.
When considering how a starting pitcher will affect a particular game, ask yourself a couple of key things: How has he performed in recent starts? Has he recently dealt with any injuries? Is the lineup he’s facing fully healthy?
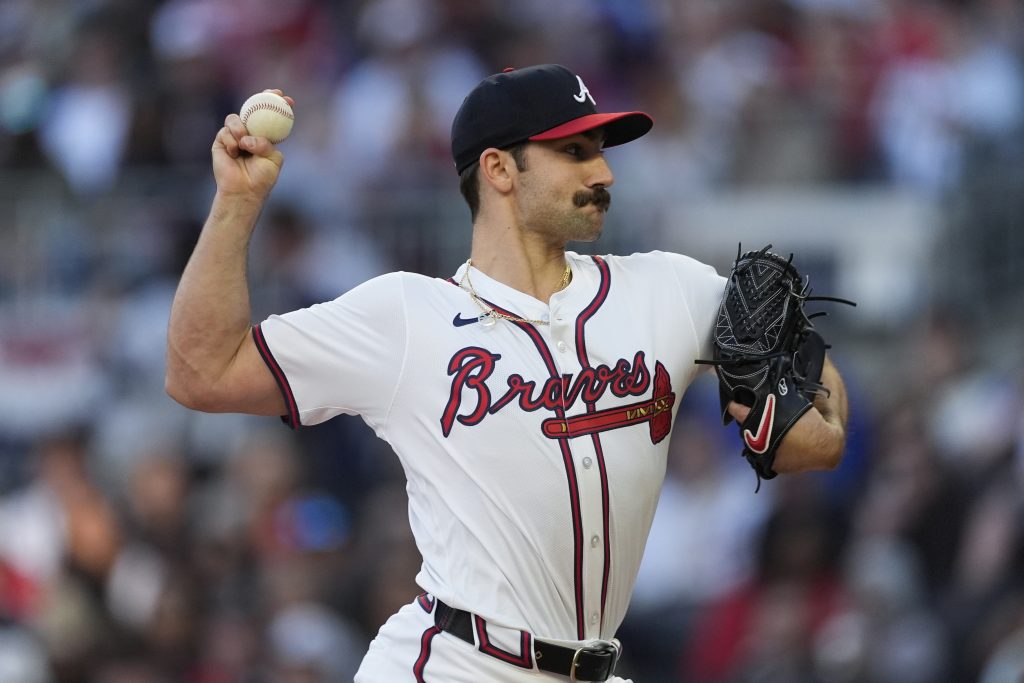
In 2023, the Atlanta Braves went 26-6 when Spencer Strider was on the mound. Photo by John Bazemore/AP.
You can check out the “listed pitcher” markets in each of the MLB matchup pages at NorthStar Bets to see the probable starters of the day.
If a pitching matchup looks particularly lopsided, you may prefer to bet on the game’s first five innings (all but ensuring bullpens won’t be involved). Bettors can find moneyline, run line and totals markets for this shortened portion of the game.
-> Want to see current MLB moneyline prices? Check the latest at NorthStar Bets
-> Want to see current MLB moneyline prices? Check the latest at NorthStar Bets
Keep in mind that an influx of openers — who only work the first inning or two — has altered the role of some starting pitchers. If you don’t know who’s throwing the majority of the game’s innings, betting on a game becomes more difficult.
Some teams who use openers will announce their long-relief pitcher for the day. Some, frustratingly, will not. Review that team’s bullpen stats to gain a sense of how it might fare on the pitching side.
Who’s in the lineup?
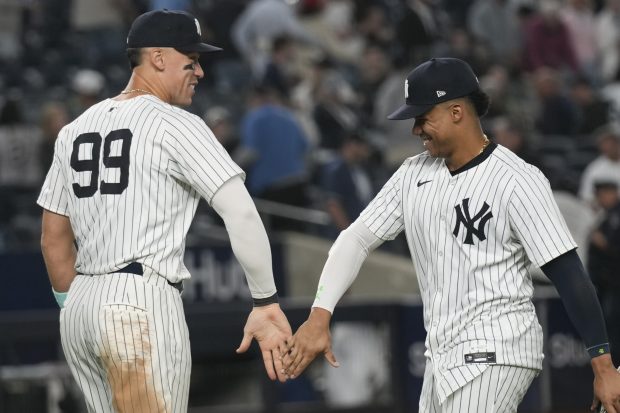
Injuries are a crucial factor for any sports wager. Ronald Acuna Jr.’s season-ending injury in 2024 affected the Atlanta Braves’ futures markets, and we see the same type of influence in game-to-game odds.
If a star like Toronto Blue Jays slugger Vladimir Guerrero Jr. went on the injured list, the ramifications would be felt across a number of betting markets.
A weakened Blue Jays team may see its team total set at a lower number because its offence would be more likely to stall as a result of Vladdy’s absence.
Hot and cold streaks
Ups and downs are inevitable in baseball. As we know, even the league’s top players fail at the plate well over half the time. On the team level, facing the same opponent in bunches can lead to excellent or unsightly streaks, too.
When a team is on an offensive heater, watch out. During the Blue Jays’ 12-1 stretch at the start of September 2021, they slashed .331/.410/.636 as a team. That’s MVP-calibre hitting, as a collective, for nearly two weeks.
Immediately after that tear, however, the Blue Jays went on a 6-7 slide with a .209/.274/.373 slash line. That’s a borderline replacement-level player, and hardly recognizable from the group we just described.
If a team’s bats start scorching, jump on the moneyline train. Just know that a derailment is possible at any time.
MLB totals
Where’s the star power?
On both sides of the ball, star players will most likely shape the outcome of a game. When it comes to totals betting, a stud pitcher can keep the lid on a matchup, while a couple of sluggers can break it open.
The Los Angeles Dodgers’ run-scoring potential, with a lineup littered with all-stars and MVPs, is mesmerizing. The Dodgers have enough skill and depth to go over on a game total all by themselves.
But starting pitchers can make a world of difference, too.
When guys like Gerrit Cole, Tarik Skubal and Chris Sale are on the hill, you should think twice about taking the over, no matter what offence lies on the other side.
It’d be nice if high-scoring offences always succeeded in surpassing run totals, but the formula is more complex than that.
Aces, like Cole, can silence any lineup. Photo by John Minchillo/AP.
Bolstered by a pair of MVP finalists, the Blue Jays scored 846 runs in 2021 (third in MLB). But their games only hit the over at a 45.1% rate, which was 27th in the majors. How could that be?
For one thing, the Blue Jays only accounted for half of the offensive innings in their baseball games. They can only do so much on their own.
Secondly, Toronto’s high-powered offence frequently inspired inflated run total projections.
Toronto saw a double-digit run total in 38 of its games in 2021, according to TeamRankings. The Arizona Diamondbacks, who led MLB with a 57.4% over rate, only saw a double-digit run total 14 times.
If you’re only bullish about one side’s offence in a particular game, you can bet on that team’s run total alone.
MLB betting strategies for props
Who’s hot and who’s not?
We’ve spoken about streakiness already, but allow us to repeat for emphasis. When you see a player on a massive 0-for streak, or you see them crushing everything, ride that wave on prop markets.
Shortly after being traded to the Dodgers in 2021, Trea Turner became one of baseball’s hottest hitters.
–> Check out the latest player props each week at NorthStar Bets – from home run hitters to pitcher strikeouts and more
-> Check out the latest player props each week at NorthStar Bets – from home run hitters to pitcher strikeouts and more
In mid-August of that year, he registered five multi-hit performances in a six-game span. Not long after that, he notched separate 16-game and 19-game hitting streaks. Put your faith in players like that until they give you a reason not to.
Ballpark factors
As with anytime touchdown or goalscorer props in other sports, home run props may be particularly enticing to some baseball bettors. These are tricky, given that even the best hitters only go yard in 25-30% of games, but finding a homer-friendly ballpark helps.
Using Statcat’s park factors, we know the Cincinnati Reds and Los Angeles Dodgers’ home stadiums have yielded the most home runs over the past three years.
On the opposite end, the stingiest parks belong to the San Francisco Giants and Oakland Athletics.
Based on wall distances and dimensions, some ballparks are great for extra-base hits — just not homers. In Boston, the Green Monster at Fenway Park has led to an MLB-high doubles rate but a below-average homer rate.
MLB futures betting strategies
How to interpret expected stats
Batted ball and pitch-tracking data create a treasure trove of expected stats for bettors to explore. But don’t get carried away. What should happen, based on exit velocity, launch angle and other metrics, is not always what comes to be.
Still, expected stats can help us identify busts and bounce-back candidates. Few players represent this notion better than former Milwaukee Brewers ace Corbin Burnes (now with the Baltimore Orioles).
In 2019, Burnes had an 8.82 ERA while allowing a .417 wOBA, which is a similar stat to on-base percentage but weighted by how a player gets on base.
According to Statcast’s expected metrics, Burnes was one of baseball’s top-five unluckiest pitchers in both categories.
Sure enough, he dominated during the shortened 2020 season before winning National League Cy Young honours in 2021. In essence, Burnes’ actual stats caught up to (and surpassed) his expected ones.
On a team level, Baseball Reference’s catch-all luck stat is the Pythagorean record, which estimates winning percentage based on run differential.
The Blue Jays’ 183-run differential in 2021 netted a 99-63 Pythagorean record, good for fifth in the majors. But some poor luck, among other factors, led to an actual record of 91-71 — just outside the playoff picture.
Given each team’s roster turnover from one year to the next, Pythagorean records are likely most helpful in the context of each season individually.
-> Ready to put your MLB knowledge to use ? Sign up for NorthStar Bets to access live odds, props, parlays and exclusive Canadian Insights all season long
-> Ready to put your MLB knowledge to use ? Sign up for NorthStar Bets to access live odds, props, parlays and exclusive Canadian Insights all season long
Internally, it’d be fair to assume the Toronto Maple Leafs futures odds still hold championship expectations for themselves. But that sentiment is waning a bit based on their current Stanley Cup line.
The latest: The Leafs have +1,600 odds to win it all in 2024-25, with eight teams situated ahead of them. On the brighter side, Auston Matthews’ futures markets suggest he’s in for another superstar season.
Check out the latest Maple Leafs futures odds for the 2024-25 NHL season.
Maple Leafs futures odds overview
Toronto lost a handful of recognizable names in free agency this year, which is always bound to happen. But with nine of last year’s top 10 scorers still on the roster (pending a possible Nicholas Robertson trade), the team is effectively running it back.
Go ahead and decide for yourself whether that’s a good thing.
Toronto topped the 100-point mark for the third consecutive season and qualified for its eighth consecutive postseason. But like all the playoff appearances before, the Leafs burned out quickly this past spring.
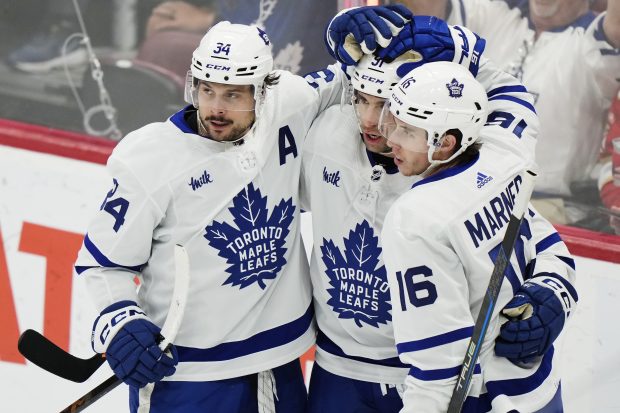
As long as the core of Matthews, Mitch Marner, William Nylander and John Tavares are together, Toronto will continue fostering Stanley Cup-sized expectations.
It’s getting more and more difficult to envision the realization of that dream, though.
Toronto entered the 2023-24 season with +1,000 odds to win the Cup, so clearly the sentiment surrounding this team has shifted a bit.
At +1,600, the Leafs’ championship odds equate to a 5.88% implied probability. Four of the eight teams ahead of them are Eastern Conference foes: reigning champion Florida Panthers (+1,100), New Jersey Devils (+1,100), Carolina Hurricanes (+1,150) and New York Rangers (+1,400).
For added context, consider that the odds for the frontrunner Edmonton Oilers (+800) are half as long as Toronto’s.
The Maple Leafs have had one playoff series win since 2004. As far as title odds are concerned, they haven’t earned the benefit of the doubt.
Given that Toronto is fifth on the Cup odds leaderboard among Eastern Conference teams, it makes sense that the Leafs have the fifth-shortest odds to win the East.
Last year, Toronto had +525 conference odds. That would be just a smidge longer than the odds for the Panthers and Devils this year, who are co-favourites at +500.
Toronto went 3-4-0 collectively against the Panthers and Devils last season.
Imagine how much different the Leafs’ odds might’ve looked in the 1960s when they hoisted the Cup four times. Mind you, there were only six teams back then. Toronto has never won a conference championship.
Fresh off a Cup win, the Panthers are the unsurprising favourites to win the Atlantic. But the Maple Leafs are right behind them.
Toronto’s only division crown since 2000 came in the fluky all-Canadian division during the COVID-shortened season a few years ago.
Recently, the Leafs have spent more seasons chasing some combination of the Panthers, Boston Bruins and Tampa Bay Lightning. But the Bruins appear to be aging out of their competitive window and the Lightning just lost Steven Stamkos, so Toronto is a logical runner-up contender behind the Cats.
Auston Matthews’ futures odds
If you’ve read this far, just know we’re done with the doom and gloom portion of the article. This section is all about Matthews, who established himself as the world’s best active goalscorer last year by potting 69 goals in the regular season.
Several NHLers had banner seasons last year, but none came close to matching Matthews in the goal department. He was 12 tallies clear of the next closest player, Sam Reinhart (57).
Matthews has now paced the NHL in goals in three of the past four seasons, averaging 61.5 goals per 82 games in that span.
Being a preseason odds-on favourite to lead the league in goals is high praise. A price like this doesn’t make for a very enticing futures wager, but it’s difficult to argue given Matthews’ stellar track record of filling the net.
Zach Edey is the biggest star in tonight’s national championship game — literally and figuratively — but I’m looking elsewhere on the prop market.
The pregame narrative: Opposite Edey, I think UConn Huskies centre Donovan Clingan is worth fading on the glass. Also, Purdue Boilermakers guard Braden Smith has an attainable number for his points/assists prop.
Check out my Purdue vs. UConn prop bets for the national championship game on April 8.
Let’s get one negative thought out of the way first: Smith is coming off his worst game of the season, scoring just three points on 1-for-9 shooting to go with six assists.
There aren’t many ways to spin-zone that performance into a positive. So instead, let’s step back and look at a larger sample of Smith’s performances.
Over his past 20 games, Smith has cashed this prop 15 times. He’s averaging 12.0 points and 7.9 assists in that span.
Purdue may run its offence through Edey, but everything starts with Smith. The sophomore point guard assists on 38.3% of the Boilermakers’ buckets when he’s on the floor, which is the 11th-highest assist rate in the country, per KenPom.
Oh, and Smith shoots 43.0% from 3-point range.
I’m not going to let one dud game discourage me from backing Smith. He’s a sharpshooter, a prominent ball-handler, and he’s been excellent against this number.
Key stat: Smith is averaging 12.0 points and 7.5 assists on the season (19.5 PA).
Quick pick
Clingan under 7.5 rebounds (-109): Clingan came on late as a scorer in Saturday’s Final Four matchup, but Alabama did a great job neutralizing him on the glass.
Clingan was frequently lured out of the paint on high ball screens and forced to close out on shooters. He finished with just five rebounds.
There’s no guarantee that Purdue will deploy a similar strategy tonight, but that shouldn’t matter. The 7-foot-2 Clingan will be at a rare size disadvantage against the 7-foot-4 Edey.
Purdue’s big man is second in the country in rebounds per game (12.2), and he’s averaging 15.4 RPG in the NCAA tournament.
This isn’t just about fading Clingan against Edey, though. UConn has many other capable rebounders who can eat up boards if Clingan finds himself even slightly out of position.
All five Huskies starters average 4.7 RPG or more.
The Toronto Blue Jays cap a three-game series with the Oakland Athletics on Sunday, and the Jays have a chance to win the series.
The pregame narrative: It’ll be a bullpen game for the Blue Jays, which could get messy, but I’m still willing to fade Oakland’s run total at plus money. Offensively, I like Vladimir Guerrero Jr. and Davis Schneider to put up solid numbers today.
Check out the best Blue Jays picks vs. the Athletics for June 9.
Last year, the Blue Jays had one of the best bullpens in baseball. They posted a 3.68 ERA (eighth in MLB) with a 1.23 WHIP (fourth).
Despite deploying largely the same crew this year, those numbers have ballooned to a 4.89 ERA (29th) and a 1.31 WHIP (19th). Bullpens can be fickle that way.
After Kevin Gausman tossed a complete game last night, Toronto will turn Sunday’s game over to Bowden Francis and a cavalcade of other short-inning arms. Every reliever should be available, which means John Schneider can target matchups that put Toronto at an advantage.
And really, this bet isn’t about Toronto’s bullpen. It’s about the guys on the other side.
The A’s have been dreadful lately, scoring just eight runs over their past six games. They’ve hit this under all six times.
On the season, Oakland has gone under 3.5 runs in 42 of 66 games (63.6%). And over the past two weeks, the A’s are batting just .200 as a team.
With all of that in mind, fading the A’s on a 3.5-run total has been a profitable play this season. And it looks especially good with the way the lineup is struggling right now.
The Blue Jays’ bullpen isn’t acting as a strength like it did a year ago, but the group has been a bit better lately, and that helps this bet, too.
Key stat: Over the past two weeks, Blue Jays relievers have allowed a .228 opponent batting average, which ranks 15th in the majors.
Quick picks
Guerrero over 1.5 bases (+114): My guy Avery Perri took this bet yesterday and it cashed on Guerrero’s fifth-inning double. Make that three games in a row for Vladdy going over 1.5 bases.
It’s no longer fair to say that Guerrero is heating up. He’s just hot. From May 8 to June 8, the first baseman has posted a .370/.452/.509 slash line.
Neither Guerrero nor anyone else on the Jays has ever faced A’s starter Mitch Spence, but I like Vlad’s chances to succeed. Over 80.0% of Spence’s pitches to righties are cutters and sliders, per Baseball Savant, and those are two offerings that Guerrero has hit very well.
Against cutters and sliders this year, Guerrero has a .286/.386/.643 slash line in 56 at-bats.
Schneider over 0.5 runs (-113): Unlike Guerrero, Schneider has gone cold in recent games. But similar to Guerrero, he crushes cutters and sliders.
In 49 at-bats against those pitches, Schneider has a .327/.353/.653 slash line. He also has an impressive 11.7% walk rate on the season, which ranks in the 84th percentile.
From the leadoff spot, Schneider is still positioned with the best opportunity to score among Jays hitters.
With 30 unique stadium designs, MLB stands out among its major professional counterparts. Unlike the NHL, NBA and NFL, where playing dimensions are uniform, MLB’s various weather patterns and wall arrangements create distinct scoring environments across the league.
In that sense, the playing field is not level. By identifying which MLB ballpark factors stick out — from friendliest to least forgiving — bettors can make more informed wagers when exploring the player prop market and deciding whether to bet the over or under on totals.
-> New to MLB wagering? Sign up at NorthStar Betsto get the latest odds, insights and betting tools throughout the season.
-> New to MLB wagering? Sign up at NorthStar Betsto get the latest odds, insights and betting tools throughout the season.
Note: The data in this article derives from a three-year rolling average (2022-24) from Statcast’s park factors page unless otherwise stated.
MLB ballpark factors: Overall run scoring
The best: Coors Field, Colorado Rockies
Coors Field is (and likely always will be) the top run-scoring environment in baseball. It caters to 25% more run production than the average park, and at least a 15% bump in singles, doubles and triples.
The foundation of this mountainous run machine is its atmosphere. Situated roughly a mile above sea level, Coors Field has lower atmospheric pressure and air density than other parks. That means less drag — and more distance — for the baseball.
Peter Hamlington, a University of Colorado professor of mechanical engineering, explained last summer that spin rates decrease at altitude, which negatively affects the ball’s ability to travel. But that also affects off-speed pitches (for instance, curveballs don’t curve as much at Coors), and it doesn’t do enough to counteract the reduced drag of a ball in flight.
-> Before you get started, create your NorthStar Bets account to explore live odds and daily MLB markets.
-> Before you get started, create your NorthStar Bets accountto explore live odds and daily MLB markets.
Other excellent run-scoring environments exist in Boston (14% above average) and Kansas City (10%), both of which we’ll touch on later.
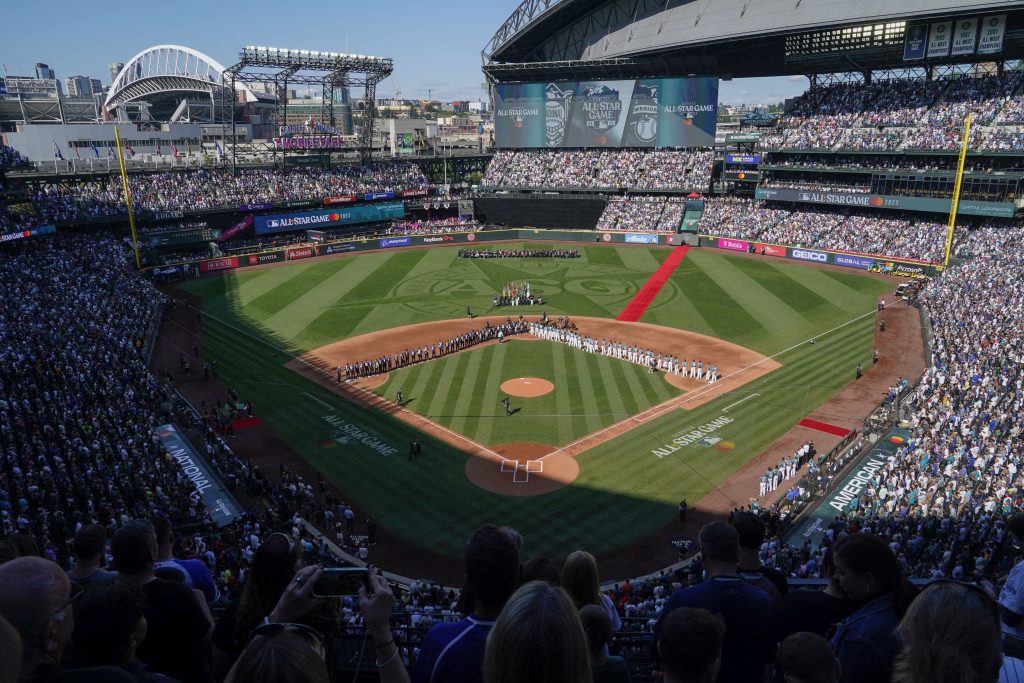
The worst: T-Mobile Park, Seattle Mariners
The Seattle Mariners have the stingiest scoring setting (17% below average), with the San Diego Padres (Petco Park), San Francisco Giants (Oracle Park) and Tampa Bay Rays (Tropicana Field) all right behind at 8% below average. Seattle is also alone in last place for batting average on contact (6% below average).
In recent seasons, the Seattle Mariners have played in the lowest-scoring offensive setting in baseball. (AP Photo/Ted S. Warren)
Why are some of these parks so run-deficient? In Seattle’s case, we know We know that Seattle’s 2024 offence was supremely underwhelming.
But there’s more to it than that. Using Statcast’s environmental factors, we know that Seattle, San Diego and San Francisco are the three coldest venues in the sport. Combine that with their sea-level status, and these West Coast parks see the ball travel less than it does elsewhere.
MLB ballpark factors: Home runs
The best: Great American Ball Park, Cincinnati Reds
Have you ever dreamed of catching a big-league home run ball? Well, grab a mitt and head to Cincinnati, where home runs are hit 26% more often than normal.
The simplest explanation is the short porches: 328 feet in left field and 325 feet in right. While the left-field wall is elevated to 12 feet, the same can’t be said for right field, where lefties like Joey Votto used to deal damage on almost a daily basis.
–> Check out the latest player props each week at NorthStar Bets – from home run hitters to pitcher strikeouts and more
-> Check out the latest player props each week at NorthStar Bets – from home run hitters to pitcher strikeouts and more
Los Angeles’ Dodger Stadium (21%) benefits from a star-studded lineup, which has finished top-five in homers each of the past seven seasons.
Every wall at Dodger Stadium is standard size (eight feet) and fewer than 400 feet from home.
The worst: Oracle Park, San Francisco Giants
A healthy gust of wind can aid a long ball in the Bay Area, but it can just as easily knock one down. San Fran, which plays in the second-coldest average temperature, allows 21% fewer home runs than average.
Oracle Park has a curiously short wall in the right-field corner (309 feet), but that’s offset by the wall’s 24-foot height … unless you’re, say, Barry Bonds. The right-centre power alley stretches 421 feet, which is great for extra bases, but brutal for four-baggers.
Kansas City’s Kauffman Stadium (14% below average) hosted all-star festivities in 2012, which led to an all-time disastrous home run derby performance. Robinson Cano, who’d won the 2011 contest, failed to hit a single ball out of the yard.
MLB ballpark factors: Triples and doubles
The best (for triples): Coors Field, Colorado Rockies
We’ve already highlighted Coors Field as a run-scoring haven, so let’s touch on a different park as one of the best for producing triples.
With a 420-foot fence in centre, Detroit’s Comerica Park is one of baseball’s worst fields for home runs. But boy, there sure is a ton of space for triples.
Take this June 9, 2021 knock by Isaac Paredes, whose deep fly found the grass in the deepest part of the park. Paredes ranked in the 37th percentile in sprint speed in that season, but thanks to Comerica’s generous dimensions, he managed to leg out his first career triple.
— FanDuel Sports Network Detroit (@FanDuelSN_DET) June 9, 2021
All told, the Tigers’ home field allows 43% more triples than average.
The best (for doubles): Fenway Park, Boston Red Sox
The Green Monster, Fenway’s 37-foot wall in left field, gobbles up would-be home runs and spits out doubles. The Monster is only 310 feet from home plate, representing one of the shortest porches in baseball. And its stature makes extra bases extra easy.
-> Want to see current MLB moneyline prices? Check the latest at NorthStar Bets
-> Want to see current MLB moneyline prices? Check the latest at NorthStar Bets
Bobby Dalbec should consider penning a thank you note to a relative of Fenway’s architect, James E. McLaughlin.
Fenway is 24% more favourable for doubles than the average park. Though its home run rate is slightly below average, the presence of the iconic Green Monster is a worthwhile trade-off at this 110-year-old park.
The worst: Mariners, Mets, Brewers
T-Mobile is not a particularly large park, and we’ve already discussed how chilly temperatures and lack of elevation sap its power. Plus, there are no quirky outfield angles to create the type of peculiar bounces that aid some triples.
Several stadiums are in a similar range for fewest doubles, though, so it’s not as if Seattle really stands out.
The Mets’ Citi Field and Brewers’ American Family Field are 14% and 11% below average, respectively, in terms of producing doubles.
-> Ready to put your MLB knowledge to use ? Sign up for NorthStar Bets to access live odds, props, parlays and exclusive Canadian Insights all season long
-> Ready to put your MLB knowledge to use ? Sign up for NorthStar Bets to access live odds, props, parlays and exclusive Canadian Insights all season long